We explore the realities of carbon emissions and how emerging markets are key to achieving net zero.
Key points:
- The UK is one of the highest importers of carbon, with over 40% of emissions embedded in trade, while US per-capita emission intensity is more than twice the figure for China, and eight times that of India.
- Europe and North America alone have contributed approximately 60% of total cumulative emissions.
- We must recognise that emerging-market economies are changing in terms of their energy consumption, but at different rates compared to more mature economies; there is no directional issue, but there is a timeline issue.
- Developed-market leaders must appreciate these challenges and provide large-scale financing support to accelerate these energy transitions.
- When deploying capital, we look for large addressable-market opportunities, tangible catalysts for traction, and leading companies – and we would argue that the best investment opportunities can be found in the developing world.
Following the close of the United Nations Climate Change Conference (COP26) last week, it is time to reflect on the outcomes of this long-awaited summit. As host of COP26, the UK has been in the spotlight, with Prime Minister Boris Johnson championing the climate agenda over the course of the two weeks. This summit was not without political tensions, as developed-nation leaders urged emerging markets to step up. Boris Johnson expressed his “hope to see India submit an ambitious reduction target at COP26”,1 while former US President Barack Obama was critical of both Russia and China for their absence, alongside his contempt for their “dangerous lack of urgency”.2 There is no escaping how critical China and India are to reaching the 2050 net-zero target and limiting dangerous temperature rises, but success depends on cooperation, as well as resisting this rhetoric which disregards some uncomfortable home truths.
The uncomfortable truth of UK emissions
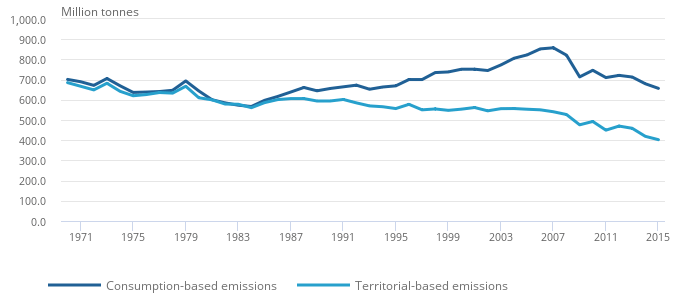
The UK has seen territorial-based CO2 emissions fall since 1972, as the economy has grown while shifting away from carbon-intensive manufacturing, with coal only a small portion of the energy consumption mix today. However, on consumption-based measures (i.e. including imports), emissions continued to rise through to 2007,3 warranting more scrutiny on the UK’s climate pledges.
Figure 1: Different measures of CO2 emissions, 1970 to 2015, UK
Source: UK Office for National Statistics, October 2019
Developed nations are high (per-capita) emitters
The UK is in fact one of the highest importers of carbon, most notably from China, with over 40% of emissions embedded in trade.4 While we are familiar with ‘greenwashing’ in the context of corporate strategies, we believe that we are also seeing it at the sovereign level.
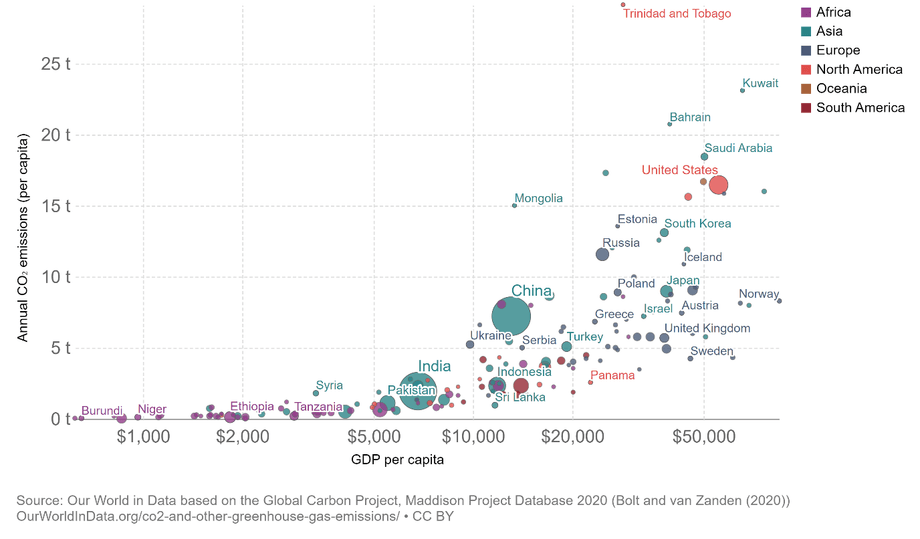
This can be demonstrated by comparing emissions and GDP on a per-capita basis. This analysis is particularly damning for the US, whose per-capita emissions intensity is one of the highest in the world – more than twice the figure for China, and eight times that of India. Notably, the US emissions intensity was 40% higher only a decade earlier.5 The UK’s peak territorial emissions in 1972 coincided with coal being almost 50% of the energy consumption mix, which bears a striking resemblance to India’s share today. It took the UK nearly four decades to reduce coal to less than 10% of total energy consumed.6
Figure 2: CO2 emissions per capita vs GDP per capita, 2018
Source: Our World in Data, 12 November 2021
GDP growth costs CO2
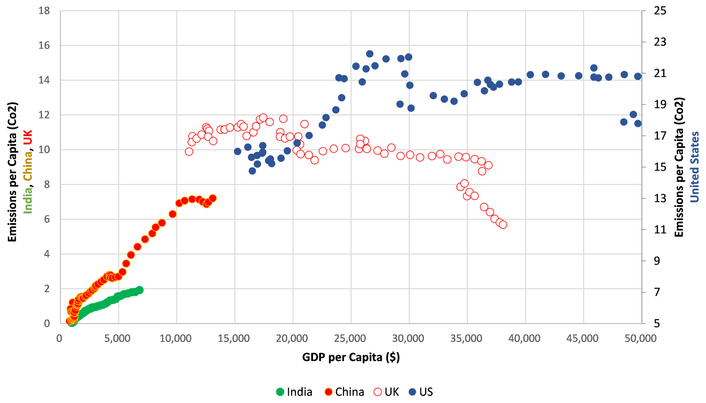
To further demonstrate the unjust nature of these demands, it is important to recognise that, as we stand today, units of GDP cost units of CO2. According to the environmental Kuznets curve, economic growth initially comes at the expense of environmental degradation, as the use of coal and high-intensity energy sources have historically supported this growth. This theory displays a turning point at a certain level of GDP where this relationship reverses, and a range of factors contribute to lower levels of damage to the environment. These factors include improved technology, higher levels of disposable income, and de-industrialisation. This directional trend has supported the progression of cleaner energy for developed countries, while GDP has continued to grow.
Figure 3: GDP vs emissions (per capita from 1950)
Source: Newton, Our World in Data, 12 November 2021
Clearly, the UK and the US, for example, are positioned to the right of the Kuznets curve, with higher GDP per capita, whereas China would currently find itself at the inflection point in the middle, and India to the left. It is crucial to highlight that this curve represents the experience of developed markets, and demonstrates the journey that many countries are still on. Emerging markets are likely to experience a shorter curve owing to developments elsewhere in the world, and therefore can leapfrog more quickly to greener solutions; however, they will be unable to avoid fossil fuels entirely owing to social consequences.
Differing timelines
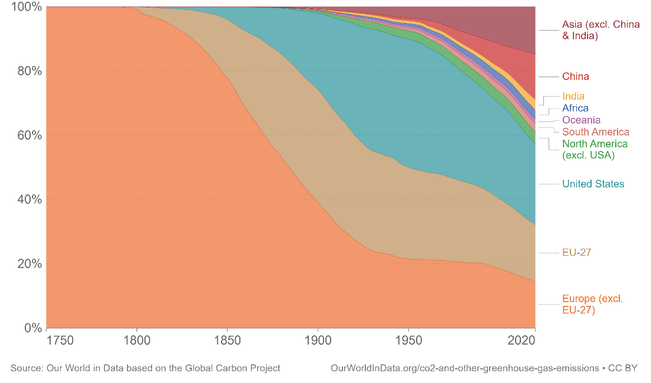
We must recognise that different countries have different timelines; therefore, is it fair to compare the emissions output of all these nations when they find themselves at very different points of economic development? It is easy for developed countries to demand reduced emissions from emerging-market countries when they have already matured using fossil fuels and have exported carbon-intensive manufacturing to these very same countries. If we compare cumulative CO2 emissions by world region as shown in figure 4, we can see that Europe and North America alone have contributed approximately 60% of total cumulative emissions, as their economies have grown.7
We believe that global leaders are right to identify emerging markets, especially China and India, as key players on the path to net zero, and in limiting temperature rises to 1.5 degrees. China and India currently represent 38% of global emissions, and this share is only going to grow. Together with the US, these countries account for over half of global emissions.8
Figure 4: Cumulative CO2 emissions by world region
Source: Our World in Data, 10 November 2021
According to the BP Energy Outlook 2020 edition, growth in renewable energy is expected to be driven by emerging economies over the next 30 years.9 Indeed, it is China, not the US or Europe, that is developing a formidable track record for execution. We estimate that 43% of global incremental installed wind and solar installations over the last three years have been in China (China’s additions over that time stand at roughly 1.6 times those of the US, the UK and European Union combined).10,11
We must recognise that emerging economies are in transition, but at different rates compared to more mature economies. There is no directional issue, but there is a timeline issue. In fact, China is the leader in solar manufacturing – which developed markets have substantially benefited from. It is for this reason that it is so important that we see better cooperation among all nations, if we want to hit net zero by 2050. The goals of China achieving net zero by 2060 and India by 2070 are in reality much more aggressive than that of the UK hitting net neutral by 2050.
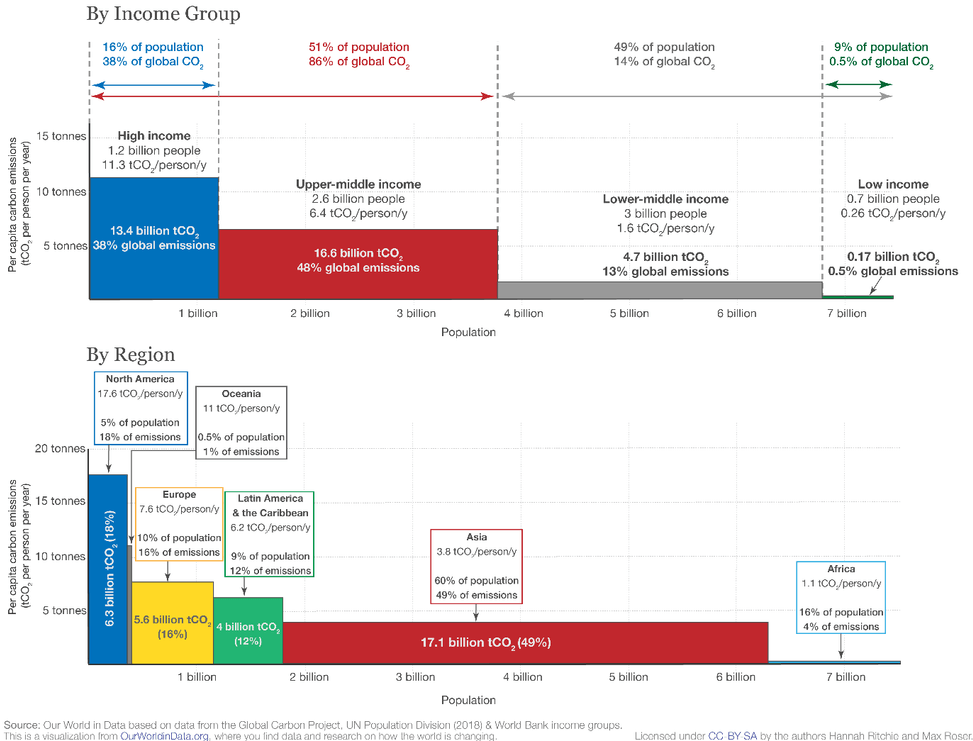
Figure 5: Global CO2 emissions by income and region
Source: Our World in Data, 15 November 2021
The challenge of a global target
COP26 presents the opportunity for nations to work together on tackling climate change; however, we have seen leaders of the more developed countries use it to pressure others on their emissions targets, while not fully acknowledging the true extent of their own role in the problem. We do not think that the best results will be achieved from lecturing emerging-market countries.
We need to recognise that China and India are indeed taking action, with aggressive 2030 pledges on renewables and CO2 emissions intensity, given the maturity of their economies and population dynamics. It is the recent commitments by China and India that have shifted the needle for climate ambitions, as acknowledged by Malte Meinshausen, a climate expert at the University of Melbourne.
Meanwhile, among all this finger pointing, we note that developed-market countries have failed to meet their own pledges. Not only is the US$100 billion annual climate financing target by wealthy nations insufficient, it has never been met.
Targets made by developing countries, including India, will rely on financing support from wealthier nations. According to Nicholas Stern, the Chair of the Grantham Institute, “the rich world must respond to prime minister Modi’s challenge to deliver a strong increase in international climate finance”.12 We must appreciate that many emerging-market economies have inferior technological endowments and much lower income levels, and that developed markets have exported carbon-intensive industries to the developing world. All the while, emerging markets’ currencies do not have the reserve status of the dollar, euro, yen or sterling, in turn depriving them of the same fiscal and monetary policy flexibilities to help support large energy-transition investments. Developed-market leaders must recognise these challenges and provide large-scale financing support to accelerate their energy transitions.
If we want to hit 2050 net-zero targets globally, it is both logical and imperative that developed-market countries should aim to comfortably beat this global average. Ultimately, it is these less developed nations that are at greater risk from physical and financial consequences of climate change,despite their disproportionately low share of emissions per person.
Win-win opportunity for emerging-market investors
It is in everyone’s interests to see ambitious net-zero targets, tangible plans to hit them, and evidence of progress. For investors, any large-scale industrial change, such as the continuing energy transition, can present major opportunities. More aggressive net-zero targets, both in developed and emerging markets, can be a win-win both for our planet and for investors. When deploying capital, we look for large addressable-market opportunities, tangible catalysts for traction, and leading companies. You can find these ingredients across the globe when hunting for energy-transition investment opportunities. However, we would argue that the best opportunities can be found in the developing world.
Developing countries represent the largest addressable market in terms of electricity consumption (China consumes almost twice as much electricity as the US),13 or indeed in terms of CO2 emissions (MSCI Emerging Market regions emit 60% of the world’s CO2 today, and their share is growing).14 We are seeing tangible catalysts for traction, particularly in the form of commitments being made by China and India. In China’s case, very impressive progress has been made in recent years. We are also experiencing a rise in leading companies in emerging markets across various energy-transition supply chains, notably in photovoltaic solar energy and electric vehicles. This is hardly surprising given the addressable market backdrop and the track record across industrialisation.
Sources:
- UK’s Johnson pressed Indian PM for ambitious emissions reduction plan, 1 November 2021
- China, Russia, U.S. Republicans harming progress on climate – Obama, Reuters, 8 November 2021
- The decoupling of economic growth from carbon emissions: UK evidence, ONS, 21 October 2019
- CO2 emissions embedded in trade, Our World in Data, accessed 11 November 2021
- CO2 emissions per capita vs GDP per capita, 2018, Our World in Data, accessed 12 November 2021
- The UK now consumes less energy than back in 1970, World Economic Forum, 7 August 2019
- Cumulative CO2 emissions by world region, Our World in Data, accessed 10 November 2021
- Annual CO2 emissions by region, Our World in Data, accessed 12 November 2021
- Energy Outlook 2020 edition, BP p.l.c., September 2020
- Wind Power, IEA, November 2021
- Solar PV, IEA, November 2021
- Cop26 emission pledges may limit global heating to below 2C, The Guardian, 3 November 2021
- Electricity domestic consumption, Enerdata, accessed 15 November 2021
- CO2 emissions, Our World in Data, accessed 15 November 2021
This is a financial promotion. These opinions should not be construed as investment or other advice and are subject to change. This material is for information purposes only. This material is for professional investors only. Any reference to a specific security, country or sector should not be construed as a recommendation to buy or sell investments in those securities, countries or sectors. Please note that holdings and positioning are subject to change without notice. Compared to more established economies, the value of investments in emerging markets may be subject to greater volatility, owing to differences in generally accepted accounting principles or from economic, political instability or less developed market practices. Newton manages a variety of investment strategies. Whether and how ESG considerations are assessed or integrated into Newton’s strategies depends on the asset classes and/or the particular strategy involved, as well as the research and investment approach of each Newton firm. ESG may not be considered for each individual investment and, where ESG is considered, other attributes of an investment may outweigh ESG considerations when making investment decisions.
Important information
This material is for Australian wholesale clients only and is not intended for distribution to, nor should it be relied upon by, retail clients. This information has not been prepared to take into account the investment objectives, financial objectives or particular needs of any particular person. Before making an investment decision you should carefully consider, with or without the assistance of a financial adviser, whether such an investment strategy is appropriate in light of your particular investment needs, objectives and financial circumstances.
Newton Investment Management Limited is exempt from the requirement to hold an Australian financial services licence in respect of the financial services it provides to wholesale clients in Australia and is authorised and regulated by the Financial Conduct Authority of the UK under UK laws, which differ from Australian laws.
Newton Investment Management Limited (Newton) is authorised and regulated in the UK by the Financial Conduct Authority (FCA), 12 Endeavour Square, London, E20 1JN. Newton is providing financial services to wholesale clients in Australia in reliance on ASIC Corporations (Repeal and Transitional) Instrument 2016/396, a copy of which is on the website of the Australian Securities and Investments Commission, www.asic.gov.au. The instrument exempts entities that are authorised and regulated in the UK by the FCA, such as Newton, from the need to hold an Australian financial services license under the Corporations Act 2001 for certain financial services provided to Australian wholesale clients on certain conditions. Financial services provided by Newton are regulated by the FCA under the laws and regulatory requirements of the United Kingdom, which are different to the laws applying in Australia.



Comments