We examine how the Russian leader’s actions have affected the market’s risk premium and what might happen next.
Key points
- Russia invaded Ukraine on 24 February, but geopolitical risk around the event had been increasing since late 2021 when Russia began amassing troops on Ukraine’s border.
- European (and global) inflation was rising ahead of the invasion, and headline consumer price inflation (CPI) had already broken out above the 2% range by mid-2021. However, Russia’s invasion and subsequent energy weaponisation has undoubtedly exacerbated the inflationary backdrop.
- Across the market, we see many areas of heightened risk premium, across equities, fixed income, currencies and commodities.
- Other driving forces of risk such as central-bank tightening are also at play, but in attempting to quantify Russian President Vladimir Putin’s impact on risk markets, we believe he has contributed significantly to the 3% rise in market-risk premiums.
- Faced with mounting losses on the battlefield, should the Russian president’s latest gambit to sow discontent in Europe by cutting off its winter-energy supply fail, his hold on power might be severely compromised by next spring.
- Should such a scenario play out, a recovery in the euro/dollar exchange rate, a compression of European sovereign and credit spreads, and a price-to-earnings multiple rerating for European equities would all be in play.
Russia invaded Ukraine on 24 February, but geopolitical risk around the event had been increasing since late 2021 as Russia gradually mobilised up to 180,000 forces on Ukraine’s border. European (and global) inflation was rising ahead of the invasion, and headline consumer price inflation (CPI) had already broken out above its 2% range by mid-2021. However, Russia’s invasion and subsequent energy weaponisation has undoubtedly exacerbated the inflationary backdrop.
We have seen German inflation expectations (5-year breakevens) rise from under 2% prior to the invasion to above 3%, while across the market we see many areas of heightened risk premium, be it in equities, fixed income, currencies or commodities. Other driving forces of risk, such as central-bank tightening are also at play, but in attempting to quantify Russian President Vladimir Putin’s impact on risk markets we believe he has significantly contributed to the 3% rise in market-risk premiums.
Market evidence
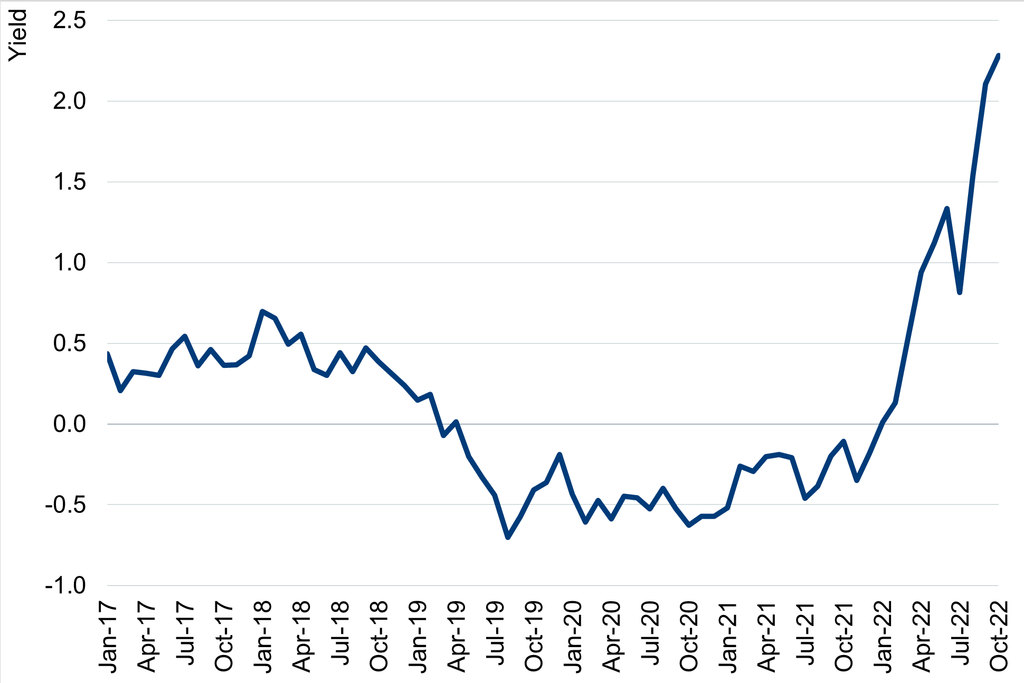
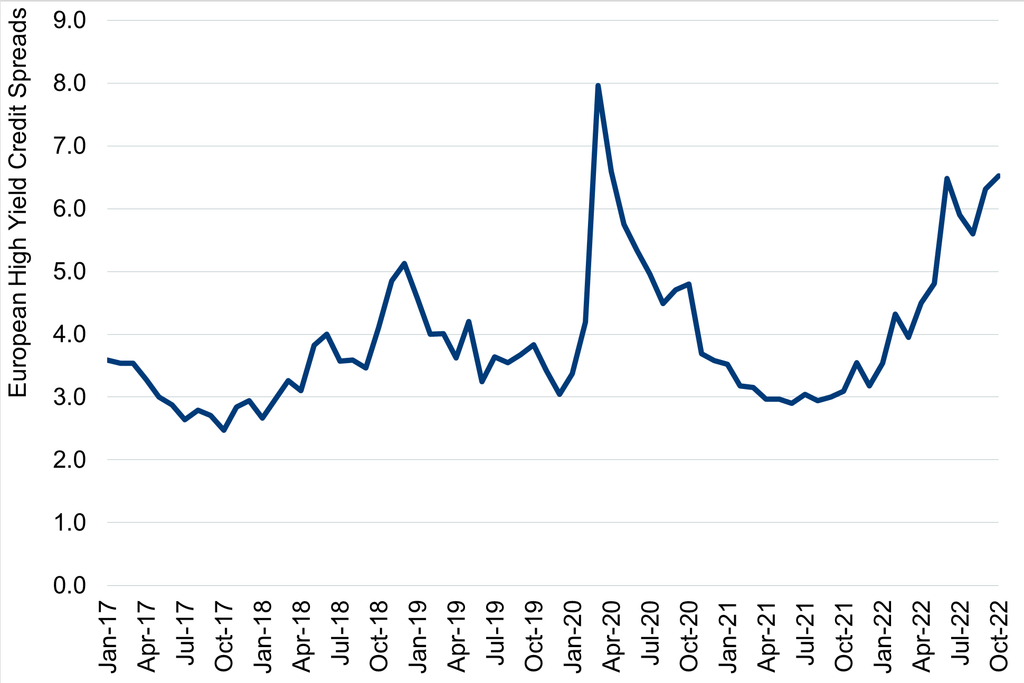
Examining market evidence to quantify this estimated Putin-related risk-premium rise, German 10-year bund yields (the anchor of European sovereign and corporate funding costs) were still below 0% at the start of the year and are now at 2.3% (as of 9 October). Italy’s equivalent 10-year sovereign-bond yield has risen from 1% to 4.7% (+3.7%) over the same time frame. This is significant because Italy is generally regarded as the bellwether for European financial stability, given its very high debt-to-GDP ratio. European corporate high-yield spreads are around 300 basis points higher than they were at the time of Russia’s Ukraine invasion and the high-yield issuance market has practically dried up.
In equities, the Stoxx Europe 600 one-year forward price-to-earnings ratio has fallen from 15x just prior to invasion to slightly above 10x today; deconstructing the Gordon Growth Model,[1] we estimate that this level of derating would be consistent with a rise in the cost of equity of between 200 and 300 basis points. Meanwhile, the euro/US dollar exchange rate has fallen by 15% since the invasion. Currency changes are driven by a range of factors, but one very important one is a country’s terms of trade and changes to its trade balance; since the onset of Russia’s aggression, the eurozone’s current account balance to GDP has deteriorated by around 3%.
In commodities markets, Brent Crude oil prices have risen from around US$80 a barrel on the eve of the invasion to around $100 a barrel today, and were as high as $120 a barrel over the summer. Although the extended Organization of the Petroleum Exporting Countries group (OPEC+) has been restoring pre-Covid levels of supply for much of this year, its latest October meeting took the decision to reduce quotas by two million barrels per day from November, angering the US administration. Russia’s influence in OPEC+ should not be underestimated, and Russia’s energy minister, Alexander Novak, recently hinted that Russia’s supply could fall by around a further one million barrels per day once Western sanctions are imposed at the end of this year. This cumulative three million barrels of curtailed supply would equate to around 3% of global oil production.
What if Putin exits or concedes?
Political history teaches us that autocratic regimes exhibit high levels of non-permanence, but market volatility around regime change can be high (especially where it involves a regime with the world’s largest nuclear arsenal). Vladimir Putin has been in power since 2000 and the widely perceived view is that most Russians are now significantly worse off, both in terms of political freedom and economically.
Significant military setbacks in Ukraine as the West continues to pour military resources into the country, ‘partial mobilisation’ including the calling up of 300,000 reservists, and recent evidence that Putin’s diplomatic sponsors are cooling towards the war, all appear to point to the Russian president’s back being against the wall. If Putin’s last gambit – attempting to freeze Europe into division and economic collapse over the winter by cutting off natural-gas supplies – fails to succeed, the springtime could prove politically decisive for Putin if Ukraine continues to make strong military gains.
Support for Putin from the political-security elite, the ‘siloviki’, could potentially evaporate. Putin could, of course, resort to the use of tactical nuclear weapons on the battlefield, a move that could undoubtedly slow down the Ukrainian advance. However, this could ultimately prove to be destructive for both Putin and his regime as moral support both domestically and from diplomatic allies would be likely to disappear completely.
With this scenario a reasonable possibility, should investors be beginning to think about what a post-Putin world could look like, and what type of regime might follow? While tail risks are quite ‘fat’ at both ends of the possible outcome distribution, we believe that the events of recent weeks have quite significantly increased the probability that Putin is either no longer at the helm in 12 months’ time or that he is forced to make concessions to end the war and begin a process of peace with Europe. If such a chain of events were to unfold, we believe that Mr ‘three per cent’ Putin would hand back much of this risk premium to European (and to a lesser extent global) markets in short order.
If this scenario becomes reality, a recovery in the euro/dollar foreign exchange rate, a compression of European sovereign and credit spreads and a price to earnings multiple rerating for European equities would all be in play. In our view, investors should keep this possibility in mind, even as Europe’s macro pain seems set to worsen over the coming winter months.
Data that we believe corroborates Putin’s 3% impact on the market-risk premium
Eurozone CPI was already at 5% on the eve of Putin’s Ukraine invasion, but war in Europe has undoubtedly exacerbated inflationary conditions, while German 10-year bund yields (the anchor of European funding costs) were still close to zero on the eve of the invasion. Since then, they have risen more than +200 basis points.
German 10-year bund yields

Source: Bloomberg, Newton Investment Management, October 2022
Price-to-earnings multiples of European stocks have fallen four turns, consistent with a +200-300bps increase in European equity cost of capital. Meanwhile, Europe’s current-account balance (goods and services) as a percentage of GDP has fallen by around 3% since the onset of hostilities (latest publicly available data to June 2022) and European high-yield credit spreads rose from 3% on the eve of Russia’s invasion, to more than 6%.
European high-yield credit spreads

Source: Bloomberg, October 2022
[1] The Gordon Growth Model is a theoretical formula that uses dividends, growth rate and cost of equity to calculate a stock or equity market’s fair value. Implied cost of equity can be deduced from the other factors in the formula.
This is a financial promotion. These opinions should not be construed as investment or other advice and are subject to change. This material is for information purposes only. This material is for professional investors only. Any reference to a specific security, country or sector should not be construed as a recommendation to buy or sell investments in those securities, countries or sectors. Please note that holdings and positioning are subject to change without notice. Compared to more established economies, the value of investments in emerging markets may be subject to greater volatility, owing to differences in generally accepted accounting principles or from economic, political instability or less developed market practices. Richard Bullock is an employee of BNY Mellon Investment Management Singapore and provides support to Newton Investment Management as a geopolitical strategist.


Comments