Our ‘population dynamics’ theme focuses on how demographic shifts will drive structural change, affecting economic growth potential and fiscal burdens, and helping us to identify investment opportunities and risks over the long term.

With life expectancy rising while birth rates have been falling, there has been much talk in recent times about ageing populations – particularly in developed markets – and the marked impact that this is having on a number of sectors and industries.
There can be no doubt that global birth rates are in sharp decline. From a recorded high of 5 children per woman between 1950 and 1955, birth rates have reached a modern-day nadir of 1.9. Lower-income countries have exceeded the global birth-rate benchmark, and will continue to see more births than more developed regions. Africa, for example, boasts a birth rate per woman that is more than double that of Europe, North America and China. Developed economies, meanwhile, will continue to lag behind the global benchmark.
Looking forward to 2030, China and India will remain the largest in absolute birth-number terms, although India’s growth rate will exceed that of China by the end of the decade, despite the reversal of China’s one-child policy. In fact, China’s birth rate – 1.6 – is more consistent with that of developed economies such as North America (1.8), Europe (1.6) and Japan (1.4).[1]
Historic and Projected Birth Rates per Woman by Income Group

Meanwhile, life expectancies are rising. Global life expectancies for both men and women have risen from an average of 53 years in 1960 to 72 in 2015; in future, with further improvements in health care and regenerative medicine, this is expected to reach 80 for men and 83 for women. This means that there will be a steady increase in the proportion of over-65s in most but not all developed markets. On a global level, this trend is already playing out: from 1960 to 2017, the proportion of the global population accounted for by over-65s has risen from 5% to 9%.[2]
Ageing: Not Just a Developed-Economy Trend
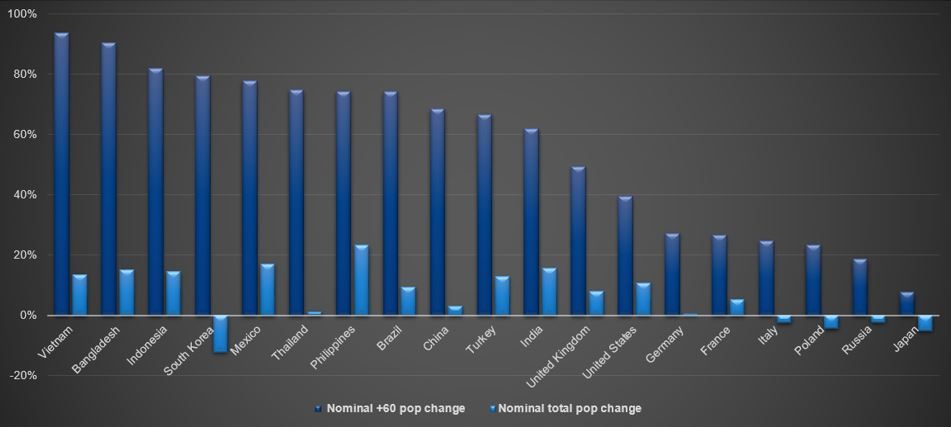
However, ageing is not a developed-market phenomenon. While there may be higher absolute numbers of over-65s in developed economies, the major growth in this cohort will come from developing countries. For example, China’s over-60 population is set to increase from 214 million in 2015 to 361 million in 2030, a 68% increase.[3] To put this figure into some kind of context, there are likely to be more over-60s in China by 2030 than the entire US population in the same year.
As the chart shows, the senior cohort is set to grow in many other populous emerging-market economies too, at a considerably faster rate than in developed markets. Indonesia is one such example: the over-60 population is projected to grow by 82%, from a 2015 base that is higher than in Italy, France and the UK.
Population Projected % Change: Over-60s vs. Total Populations, 2015-2030

Middle Aged and Middle Class
A second key demographic trend that we are closely analyzing is the growth of the middle class. In this context, 2018 marked the first time that more than 50% of the global population entered what the World Data Lab (in conjunction with the World Bank and Brookings Institution) call the ‘global middle-class’ and/or ‘rich’ (higher income) thresholds. These are classified as households which spend between $11 and $110 per person per day. What is more, the ‘middle-class’ segment is projected to grow more quickly than any other, with over 170 million people globally entering this cohort each year by 2022.
As with ageing populations, the majority of this growth is expected to happen in emerging markets, and specifically in Asia. By 2022, up to 88% of the projected new middle-class participants will be resident in Asia, which equates to 380 million Indians, 350 million Chinese, and an additional 280 million spread across the rest of Asia (with the bulk in Indonesia). Looking further forward to 2030, up to 65% (or 3.4 billion) of new global middle-class participants will be in Asia. Meanwhile, middle-class growth in the West is set to stagnate.[4]
Greater Dependency
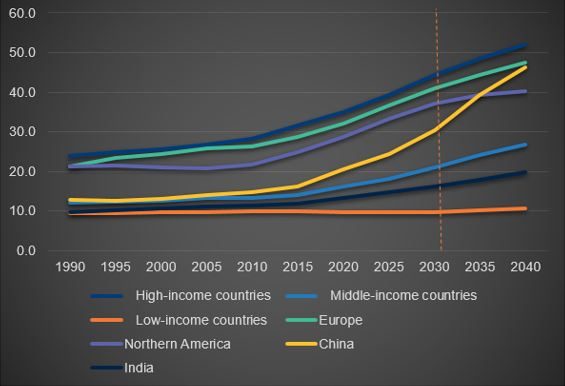
One impact of ageing populations will be an increase in global dependency ratios (the percentage of non-working-age to working populations). This will compound the already significant retirement savings gap (the gap between current provisions for retirement and what is deemed necessary to generate a desirable income for retirees), and place additional pressures on government balance sheets.
If we analyze the number of over-65s per 100 of total populations aged 25-64, the trend points towards greater dependency among high-income countries (with Europe and North America tracking this benchmark). However, what starts to become apparent when looking to 2030 and beyond is the growing number of Chinese dependents. Between 2015 and 2030, dependency in China is likely to increase by 88%. While this is starting from a lower base, this will far outstrip the dependency growth in Europe (43%) and North America (50%).
Ratio of Over-65s per 100 Total Populations Aged 25-64

Demographics and Wealth
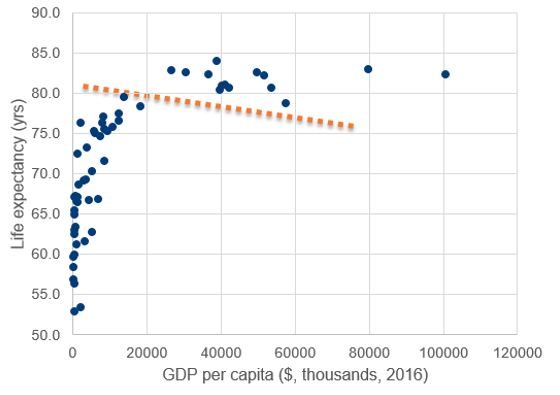
The future relationship between ageing (life expectancy) and wealth (GDP per capita) can be analyzed using the Preston Curve. In short, countries with higher national incomes per head tend to have higher life expectancies; the curve also implies a life expectancy to GDP-per-capita ceiling –once a country reaches a certain income level ($25,000-30,000 per capita, per annum), life expectancy begins to flatten.

The Preston Curve highlights how more ‘mature’ end markets such as the UK, US and Japan, where life expectancy to GDP-per-capita ratios appear to have reached a plateau, should remain attractive ‘longevity’ propositions in terms of demographics and absolute dollar spend. By contrast, those markets charting the steepest part of the curve (to the extreme left of the chart) are countries with increasingly ageing populations, coupled with room for GDP-per-capita growth. The data indicates that these countries are concentrated in emerging markets, across Asia, Africa and, to a lesser extent, South America.
Turning to the middle-aged, middle-income cohorts, global middle-class expenditure reached $34.8 trillion in 2015, being largely evenly divided between developed and developing economies. However, it is the expected growth where we are likely to see divergence. In developed countries, middle-class consumption growth is stagnating at around 0.5 to 1% per annum; emerging markets, in contrast, are forecast to see annual growth of between 6-10%, based on present growth outlooks.
Looking forward to 2030, analysis of the data puts global middle-class expenditure at between $60-65 trillion, the bulk of which will come from Asia. Conversely, the North American and European share of middle-class expenditure could decline as much as 40% from 2015-2030, though nominal dollar spend will still increase but at a considerably slower rate than in Asia.[5]
Investment Implications
These shifts in demographics are likely to have pronounced effects across economies, with the potential to affect a multitude of sectors and products, so are critical areas to track from an investment perspective.
Leaving aside health care as one obvious beneficiary of an ageing population, sectors which are likely to be influenced by this demographic trend include home improvements and housing. With a high proportion of retirees unwilling to move into retirement homes and preferring to ‘age in place’, it is reasonable to assume that future policy may recognize this, with implications for housing and beneficiaries of home-improvement spending. Travel is another likely beneficiary of an aged population. In the US, Europe and the UK, over-65s are travelling more, for longer durations, and are increasingly spending more than other age cohorts per trip.
The growing emerging-market middle class also has the potential to affect a large number of sectors and products. With many of those moving into the middle class in countries like China coming from younger cohorts, they are likely to be increasingly connected and technology-savvy. Sectors such as online grocery shopping, which currently have low penetration in China, have strong growth potential. In addition, with personal educational attainment, or the provision of future educational success for children, a key hallmark of this socio-economic class, we see growth opportunities in companies providing online education services.
[1] Source: United Nations Population Division, World Population Prospects: the 2017 Revision
[2] United Nations Population Division. World Population Prospects: 2017 Revision, or derived from male and female life expectancy at birth from sources such as: Census reports and other statistical publications from national statistical offices; Eurostat: Demographic Statistics; United Nations Statistical Division. Population and Vital Statistics Report; U.S. Census Bureau: International Database; Secretariat of the Pacific Community: Statistics and Demography Programme; Newton Investment Management analysis.
[3] Source: United Nations Population Division. World Population Prospects: 2017 Revision; Newton Investment Management analysis
[4] Source: Brookings Institution; Newton Investment Management analysis
[5] Source: Brookings Institution; World Bank PovCal Database; UN University World Institute for Development Economics Research, World Income Inequality Database; Newton Investment Management analysis. For each country, a household survey, household expenditure from national accounts, populations, and GDP growth projections are used.
Any reference to a specific security, country or sector should not be construed as a recommendation to buy or sell investments in those countries or sectors. Please note that holdings and positioning are subject to change without notice. Compared to more established economies, the value of investments in emerging markets may be subject to greater volatility, owing to differences in generally accepted accounting principles or from economic, political instability or less developed market practices.
Important information
This is a financial promotion. Issued by Newton Investment Management Limited, The Bank of New York Mellon Centre, 160 Queen Victoria Street, London, EC4V 4LA. Newton Investment Management Limited is authorized and regulated by the Financial Conduct Authority, 12 Endeavour Square, London, E20 1JN and is a subsidiary of The Bank of New York Mellon Corporation. 'Newton' and/or 'Newton Investment Management' brand refers to Newton Investment Management Limited. Newton is registered in England No. 01371973. VAT registration number GB: 577 7181 95. Newton is registered with the SEC as an investment adviser under the Investment Advisers Act of 1940. Newton's investment business is described in Form ADV, Part 1 and 2, which can be obtained from the SEC.gov website or obtained upon request. Material in this publication is for general information only. The opinions expressed in this document are those of Newton and should not be construed as investment advice or recommendations for any purchase or sale of any specific security or commodity. Certain information contained herein is based on outside sources believed to be reliable, but its accuracy is not guaranteed. You should consult your advisor to determine whether any particular investment strategy is appropriate. This material is for institutional investors only.
Personnel of certain of our BNY Mellon affiliates may act as: (i) registered representatives of BNY Mellon Securities Corporation (in its capacity as a registered broker-dealer) to offer securities, (ii) officers of the Bank of New York Mellon (a New York chartered bank) to offer bank-maintained collective investment funds, and (iii) Associated Persons of BNY Mellon Securities Corporation (in its capacity as a registered investment adviser) to offer separately managed accounts managed by BNY Mellon Investment Management firms, including Newton and (iv) representatives of Newton Americas, a Division of BNY Mellon Securities Corporation, U.S. Distributor of Newton Investment Management Limited.
Unless you are notified to the contrary, the products and services mentioned are not insured by the FDIC (or by any governmental entity) and are not guaranteed by or obligations of The Bank of New York or any of its affiliates. The Bank of New York assumes no responsibility for the accuracy or completeness of the above data and disclaims all expressed or implied warranties in connection therewith. © 2020 The Bank of New York Company, Inc. All rights reserved.


Comments